Session 4: Performance measurement
Contents
Session 4: Performance measurement#
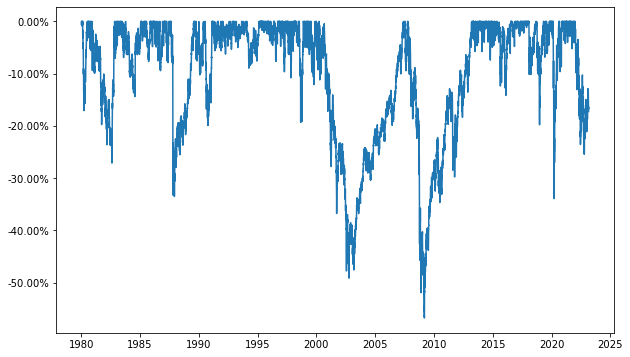
Maximum drawdown#
import os
import numpy as np
import pandas as pd
import matplotlib.pyplot as plt
import warnings

warnings.simplefilter('ignore')

#os.chdir(r'C:\Users\cdes1\OneDrive - ICHEC\Documents\Cours\PortfolioManagement')
os.chdir(r'/Users/christophe/OneDrive - ICHEC/Documents/Cours/PortfolioManagement')

df = pd.read_csv('data/SP500.csv', index_col=0, parse_dates=True)

rets = df.pct_change().dropna()
dates = df.index[1:]
# convert to numpy
rets = np.array(rets[rets.columns[0]])
drawdown = np.zeros_like(rets)
max_DD = np.zeros_like(rets)
to_through = np.zeros_like(rets)
recovery = np.zeros_like(rets)

runs = []

# initialisation at first date
drawdown[0] = rets[0]
max_DD[0] = rets[0]
to_through[0] = 1

length = 1
to_through = 1
start = dates[0]
start_t = 0
bottom = dates[0]
bottom_t = 0

for t in range(1, len(rets)):
    cum_r = (1+drawdown[t-1])*(1+rets[t])-1
    drawdown[t] = np.minimum(0, cum_r)
    # on continue la serie
    if (drawdown[t] < 0) and (t < len(rets)-1):
        length = length + 1
        if max_DD[t-1] < drawdown[t]:
            max_DD[t] = max_DD[t-1]
        else:
            max_DD[t] = drawdown[t]
            bottom = dates[t]
            bottom_t = t

    else: # on recommence une serie
        # on stocke toutes les infos
        to_through = bottom_t - start_t
        recovery = t - bottom_t
        end = dates[t]
        if t == len(rets)-1:
            end = np.NAN # we have not recover yet
        infos = {'start': start,
                 'bottom': bottom,
                 'end': end,
                 'to_through': to_through,
                 'recovery': recovery,
                 'nbDays': length,
                 'maxDD': max_DD[t-1]}
        runs.append(infos)
        # puis on reinitialise les variables
        length = 1
        start = dates[t]
        start_t = t
        bottom_t = t

df_dd = pd.DataFrame(data=drawdown, index=dates, columns=['Drawdown'])
fig, ax = plt.subplots(figsize=(10, 6))
ax.plot(df_dd['Drawdown'])
vals = ax.get_yticks()
ax.set_yticklabels(['{:,.2%}'.format(x) for x in vals]);
df_runs = pd.DataFrame(runs)
df_runs.sort_values(by='maxDD', ascending=True, inplace=True)
df_runs.head(n=10)
| start | bottom | end | to_through | recovery | nbDays | maxDD | |
|---|---|---|---|---|---|---|---|
| 531 | 2007-10-09 | 2009-03-09 | 2013-03-28 | 355 | 1021 | 1376 | -0.567754 |
| 522 | 2000-03-24 | 2002-10-09 | 2007-05-30 | 637 | 1166 | 1803 | -0.491469 |
| 786 | 2020-02-19 | 2020-03-23 | 2020-08-18 | 23 | 103 | 126 | -0.339250 |
| 195 | 1987-08-25 | 1987-12-04 | 1989-07-26 | 71 | 414 | 485 | -0.335095 |
| 42 | 1980-11-28 | 1982-08-12 | 1982-11-03 | 430 | 58 | 488 | -0.271136 |
| 877 | 2022-01-03 | 2022-10-12 | NaT | 195 | 92 | 287 | -0.254251 |
| 214 | 1990-07-16 | 1990-10-11 | 1991-02-13 | 62 | 86 | 148 | -0.199187 |
| 738 | 2018-09-20 | 2018-12-24 | 2019-04-23 | 65 | 81 | 146 | -0.197782 |
| 477 | 1998-07-17 | 1998-08-31 | 1998-11-23 | 31 | 59 | 90 | -0.193360 |
| 17 | 1980-02-13 | 1980-03-27 | 1980-07-14 | 30 | 74 | 104 | -0.170719 |